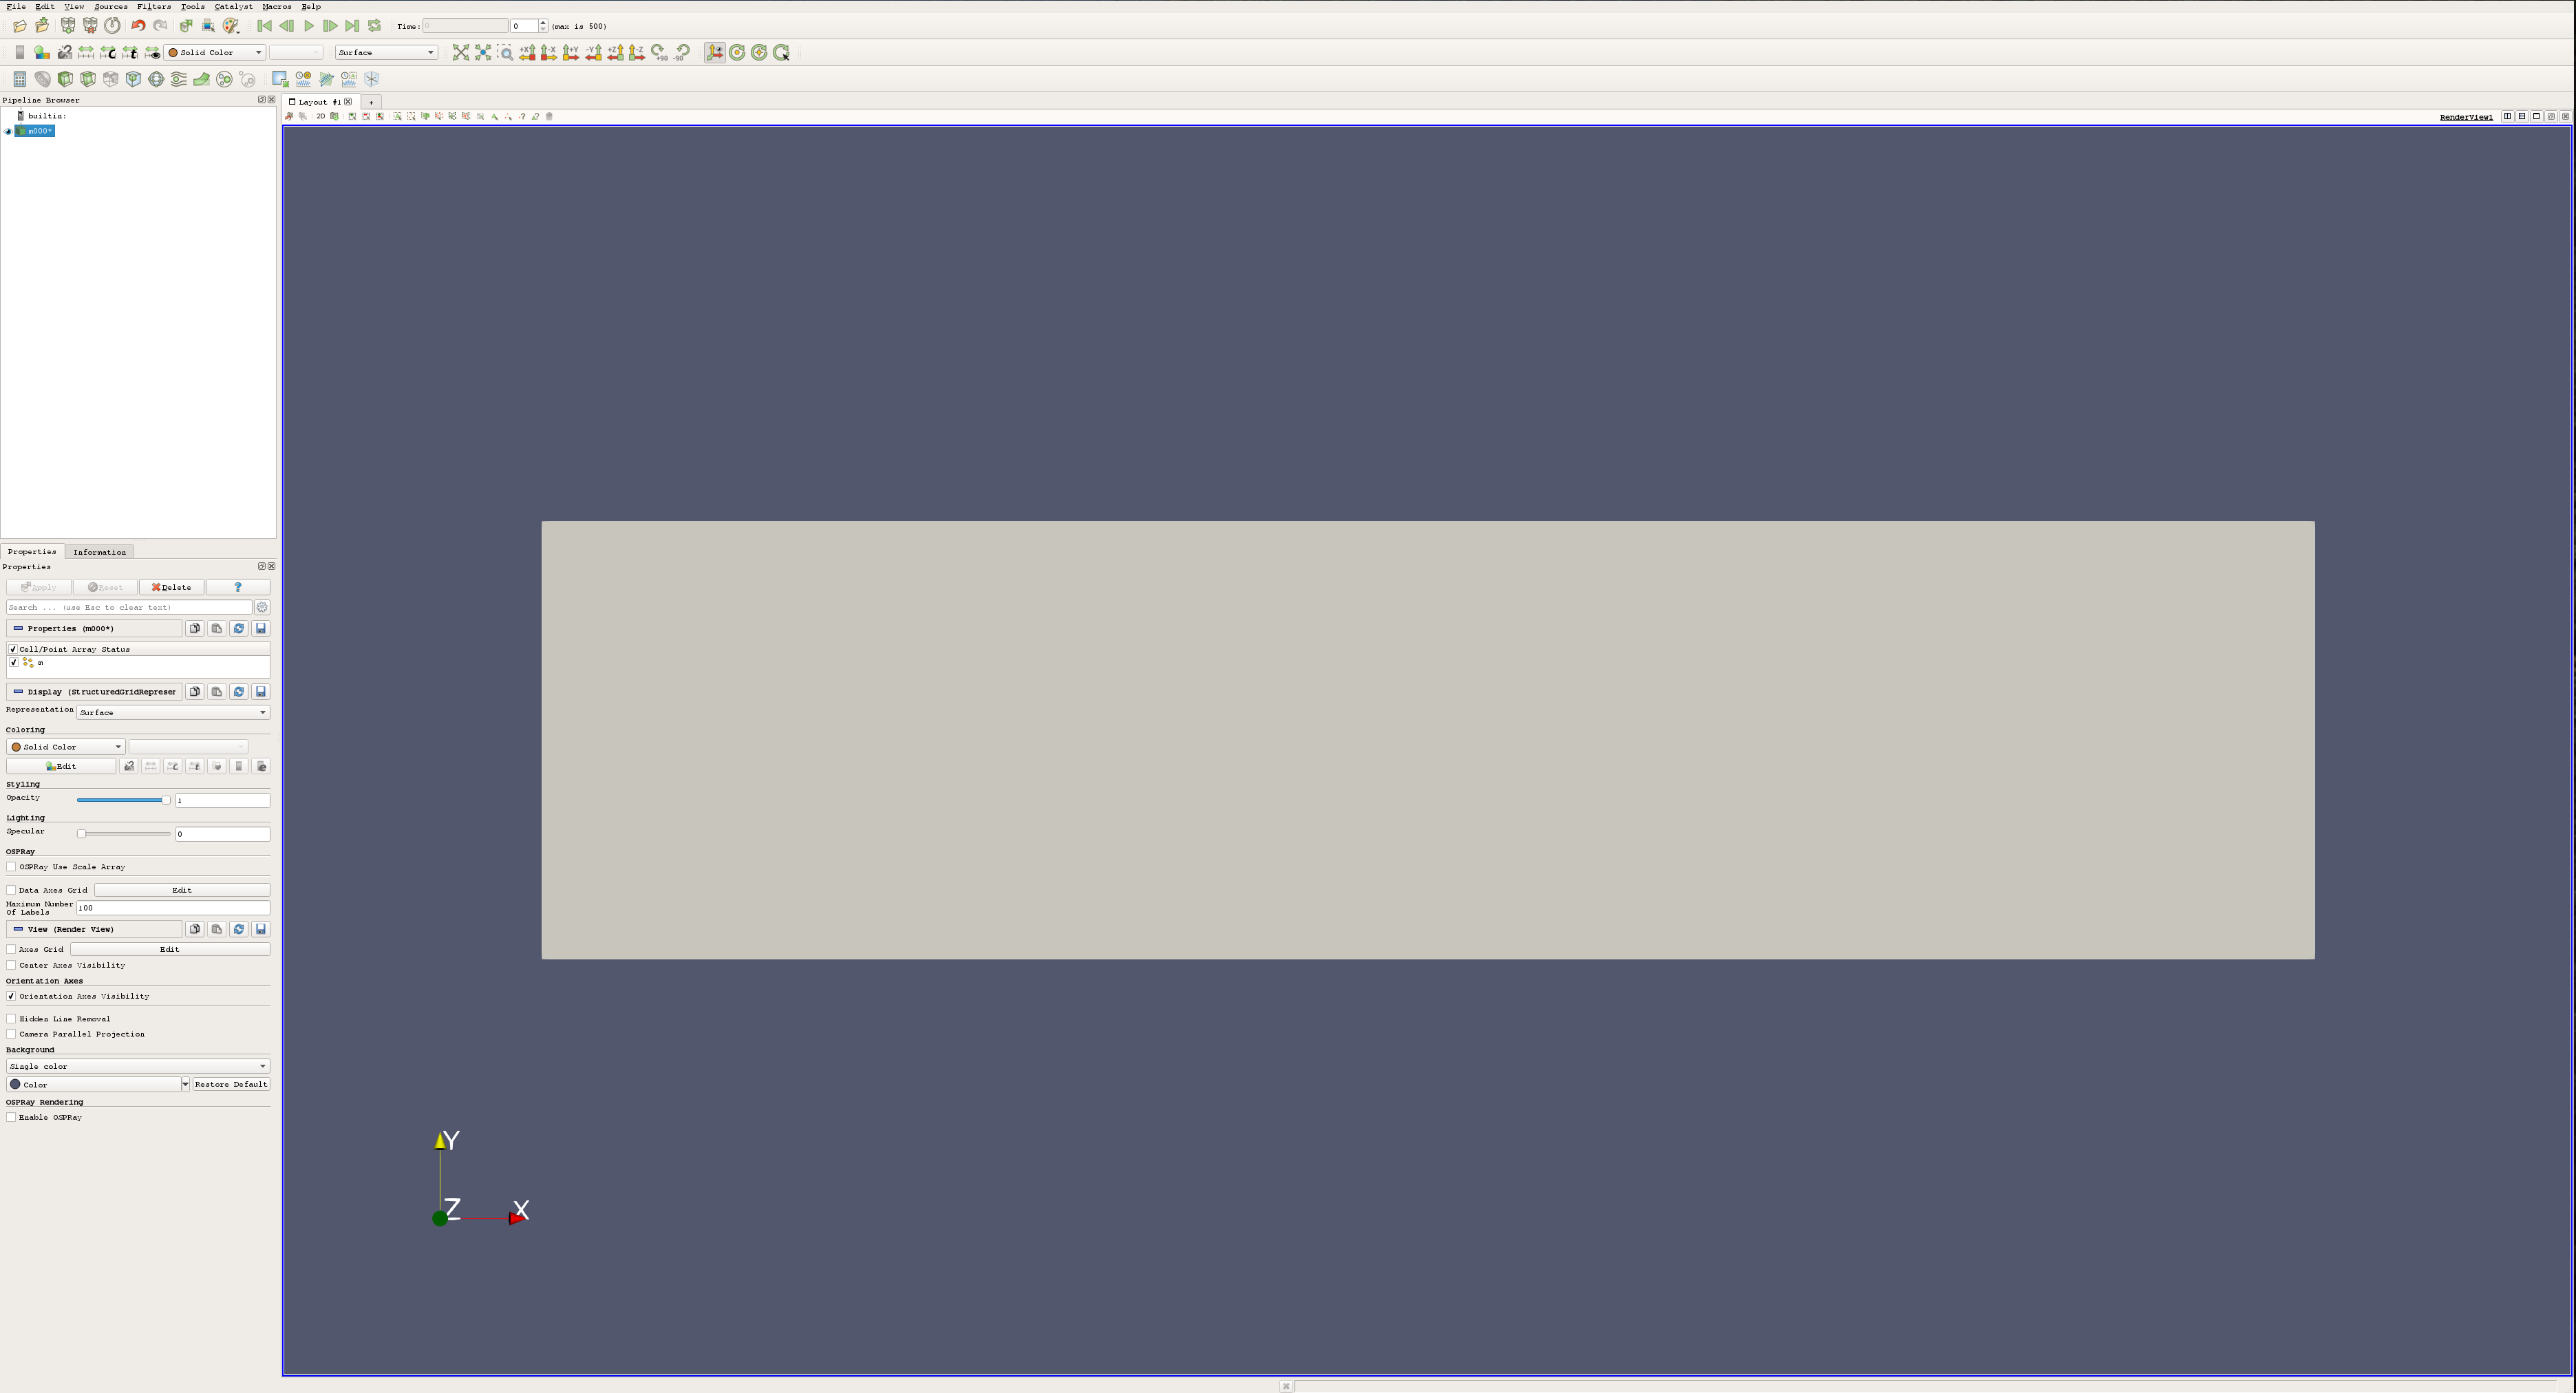
I simulate magnetic materials for science. The output of the simulation package that I use is a binary data format (ovf) which I then convert into VTK format. These VTK files contain snapshots of my magnetic material at different points in time, and they can be easily viewed and manipulated using Paraview, a free and open source scientific data analysis and visualization tool developed and maintained by Kitware. If you’re familiar with Kitware (cmake, vtk, …), you probably already know that the documentation for these tools is …incomplete? A work in progress? Look, if you work at Kitware, I’m really sorry, this isn’t some sort of attack on you - I know how difficult good documentation can be. But there’s a really steep learning curve, so I’m hoping that showcasing how I use Paraview will help others get over this barrier. Here’s what the data looks like when I load it in:
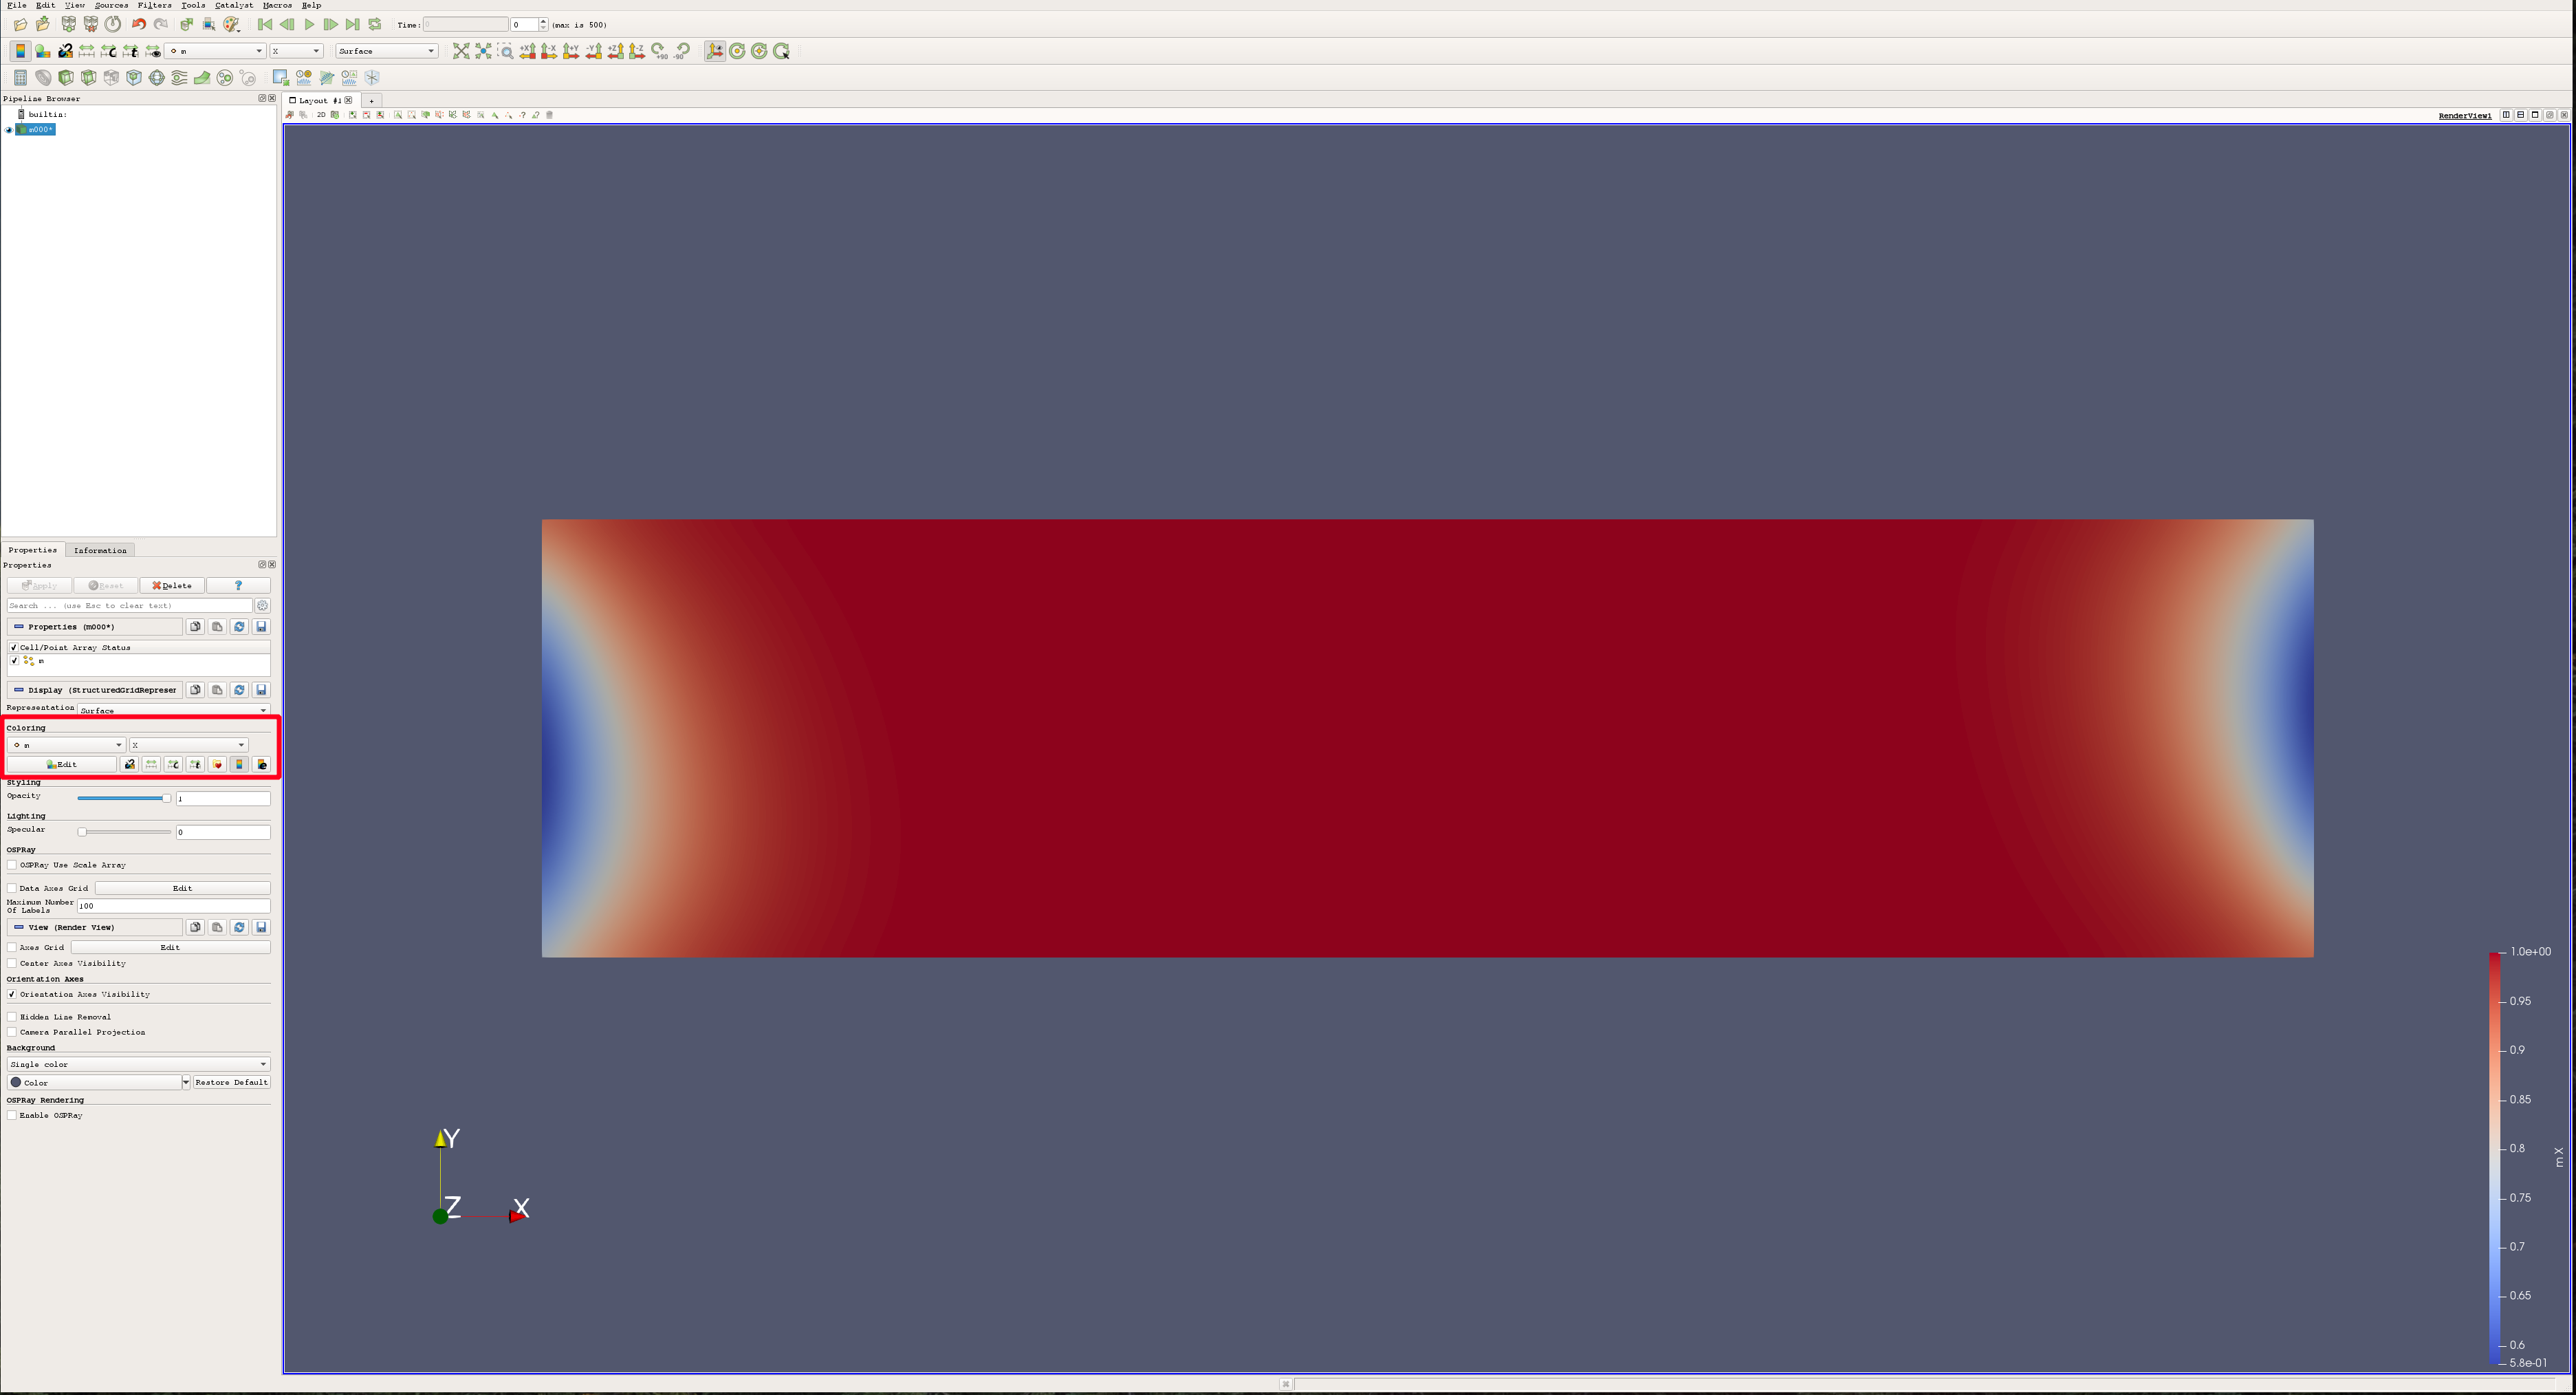
My data is a bunch of vectors (here, representing magnetization) stored on a grid in 3D space. I can visualize these vectors in a number of different ways. I can color my simulation region by a vector component:
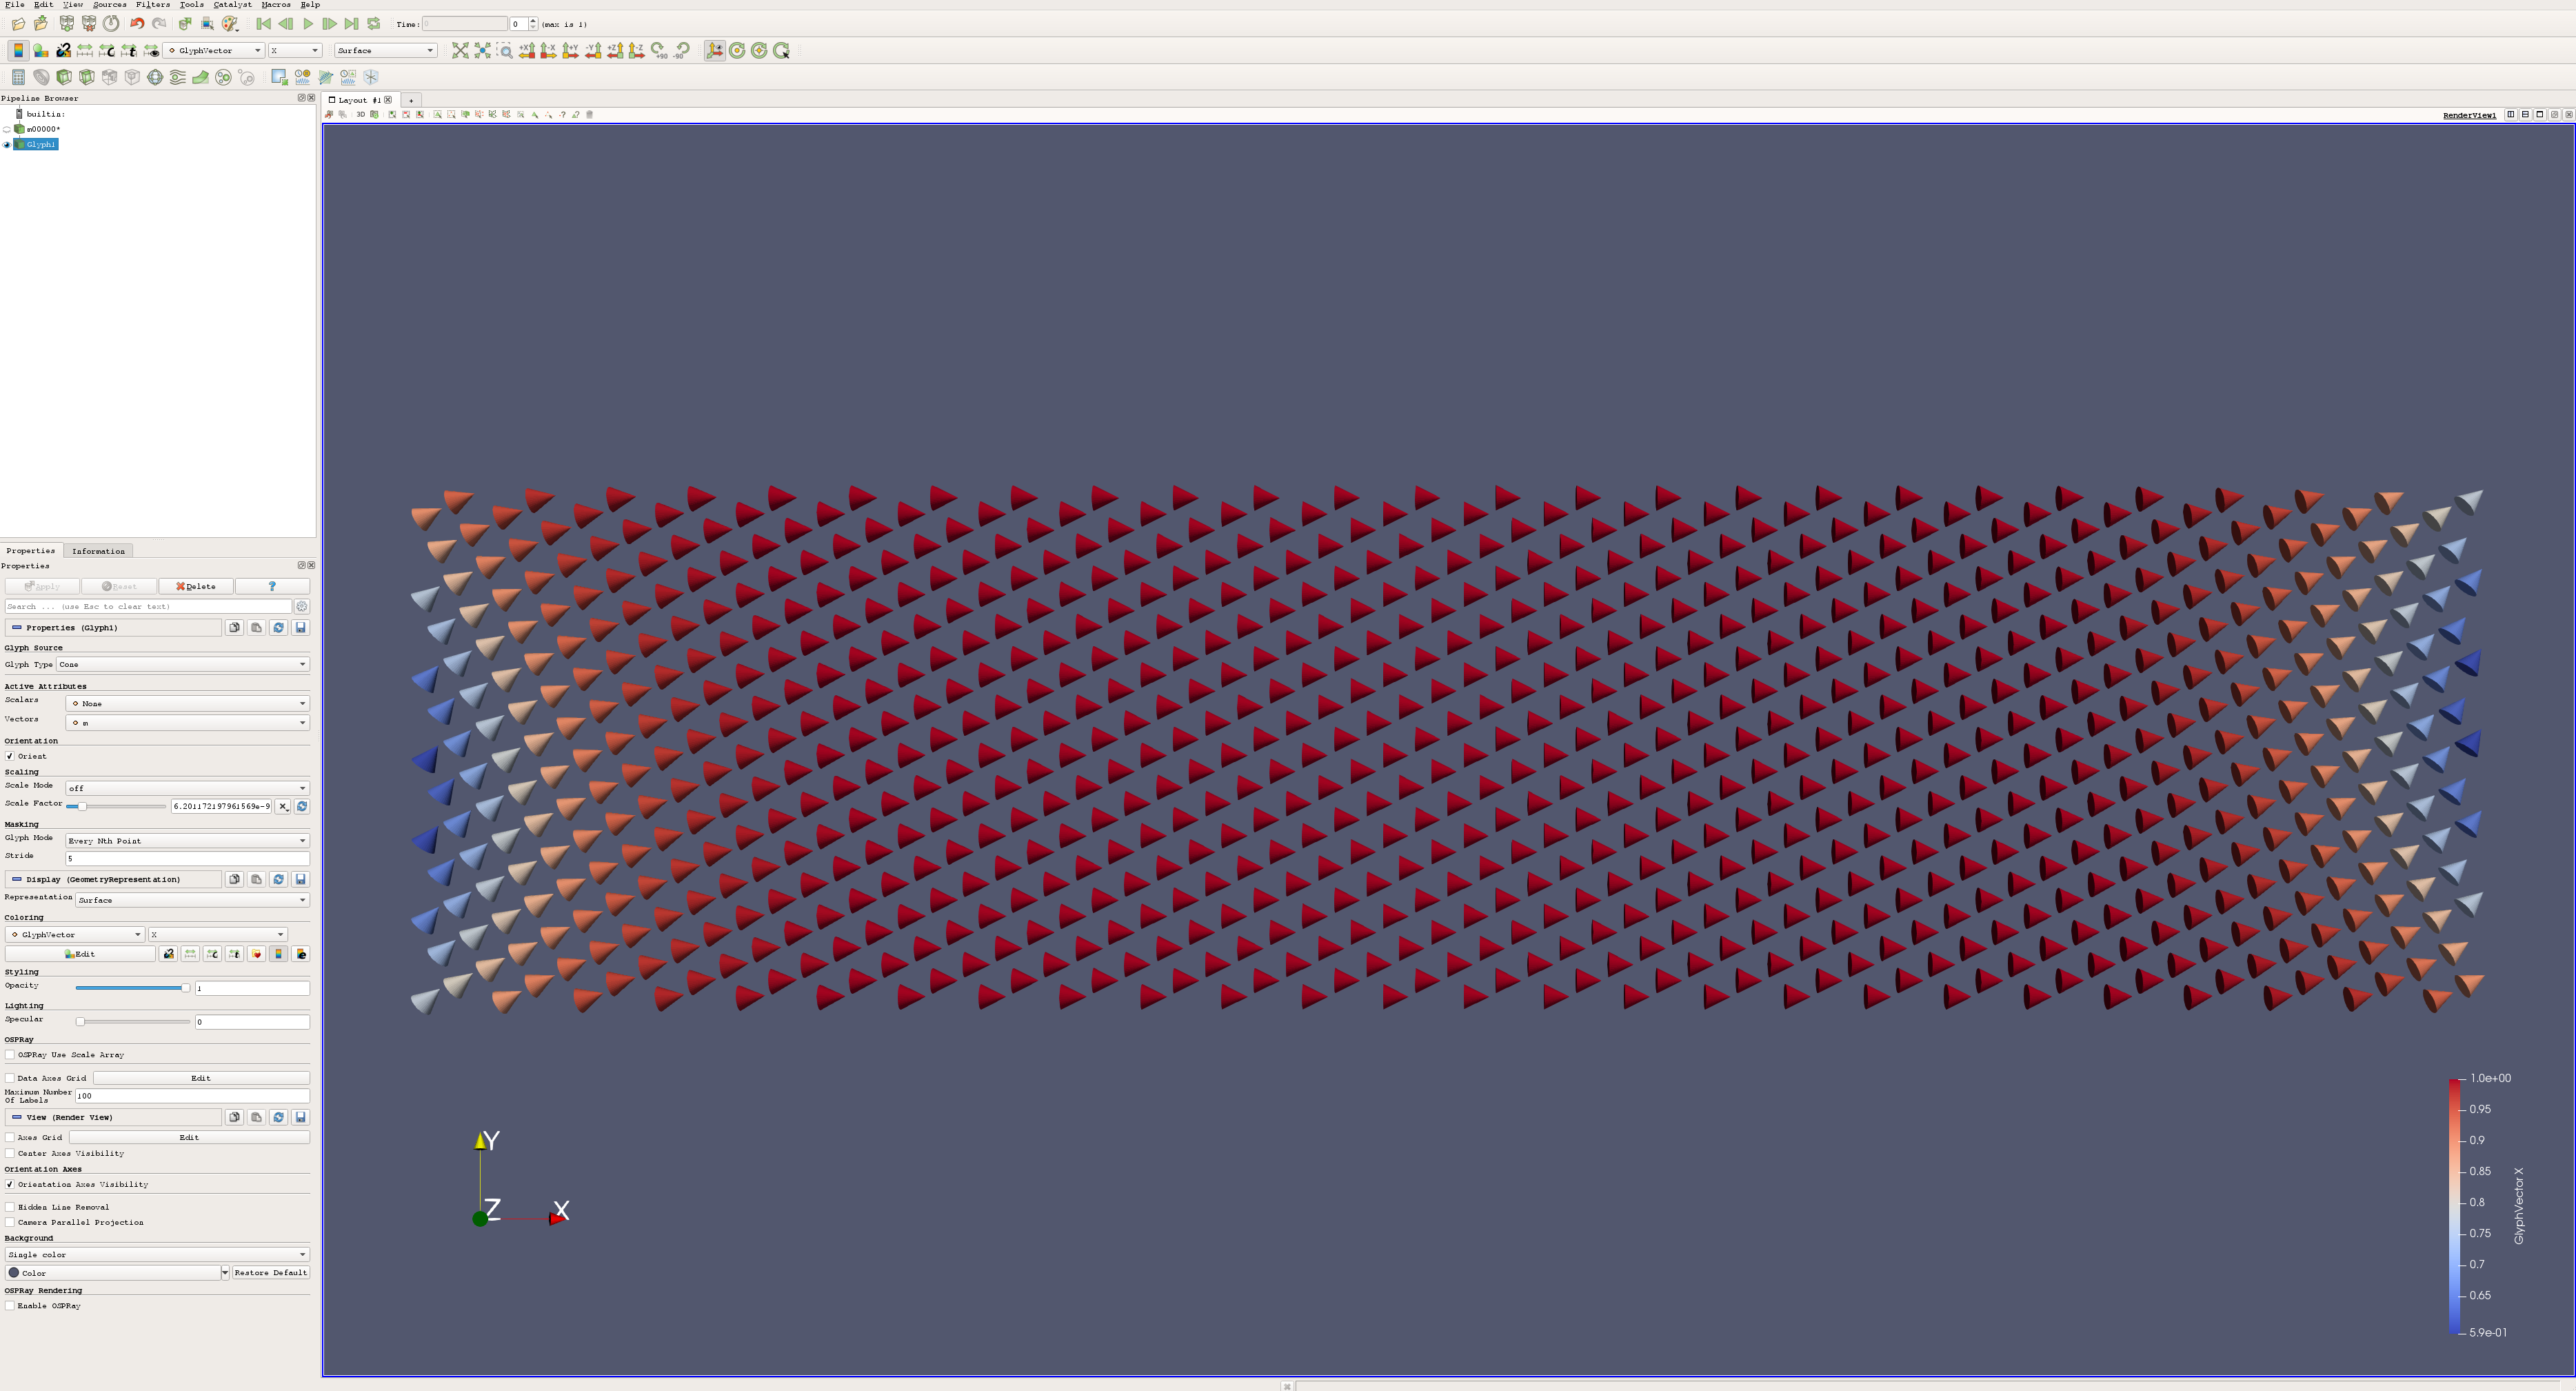
Or I can represent my vectors using glyphs, (here I use cones to show the direction, and color to highlight the x-component of each vector):
This is great for investigating data, but you wouldn’t want to use this for publications or serious
graphics. For that stuff, what you need is ray tracing - you need
blender1. Select your data in the Pipeline Browser and click
File->Save Data.... Save it as a .ply file, and at the prompt, be sure to save the color data
and alpha values2. Then open up blender and choose File->Import->Stanford (.ply), and load
your data. Voilà! Now you can add lighting, effects, animations, and whatever else you want.
When imported into Blender the entire dataset is imported as a single mesh (even if there were
multiple glyphs in your dataset in Paraview). Colormap data that was applied in Paraview gets
exported too, but by default it won’t show up after the data has been imported. Instead of being
stored in a material, as color usually tends to be for blender objects, it is stored in the mesh.
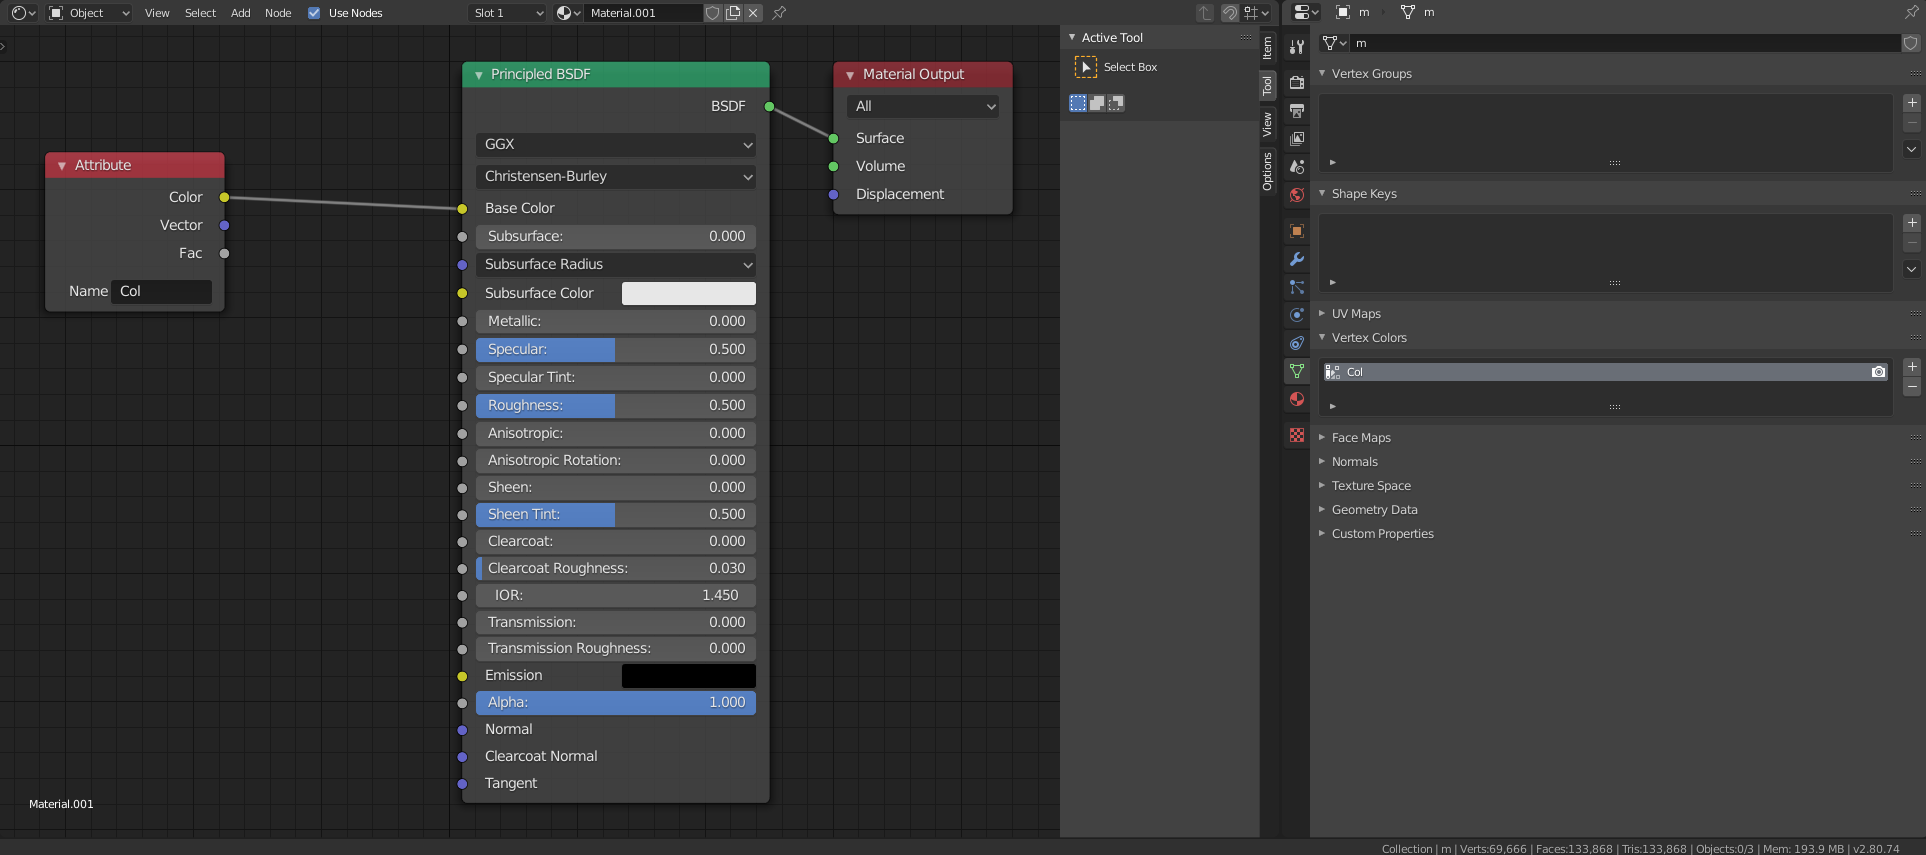
To add the color back, first make sure you’re using the Cycles render mode. In the Properties
area, open the Object tab, and under the collapsable Vertex Colors menu, you should see an entry
for an attribute named Col. This is the name given to the color data by paraview. With the
imported data selected, open the Node Editor, create an Attribute Node, and enter Col into
the Name field:
Now, when the 3D view is set to Rendered, the imported mesh should be colored according to the
colormap that was applied in Paraview. From here, the possibilites are huge - you can get realistic
lighting, special effects, render movies, and make production quality visualizations which go way
beyond anything you’ve even seen on the cover of Nature. Here are just a few examples of my own
renders:
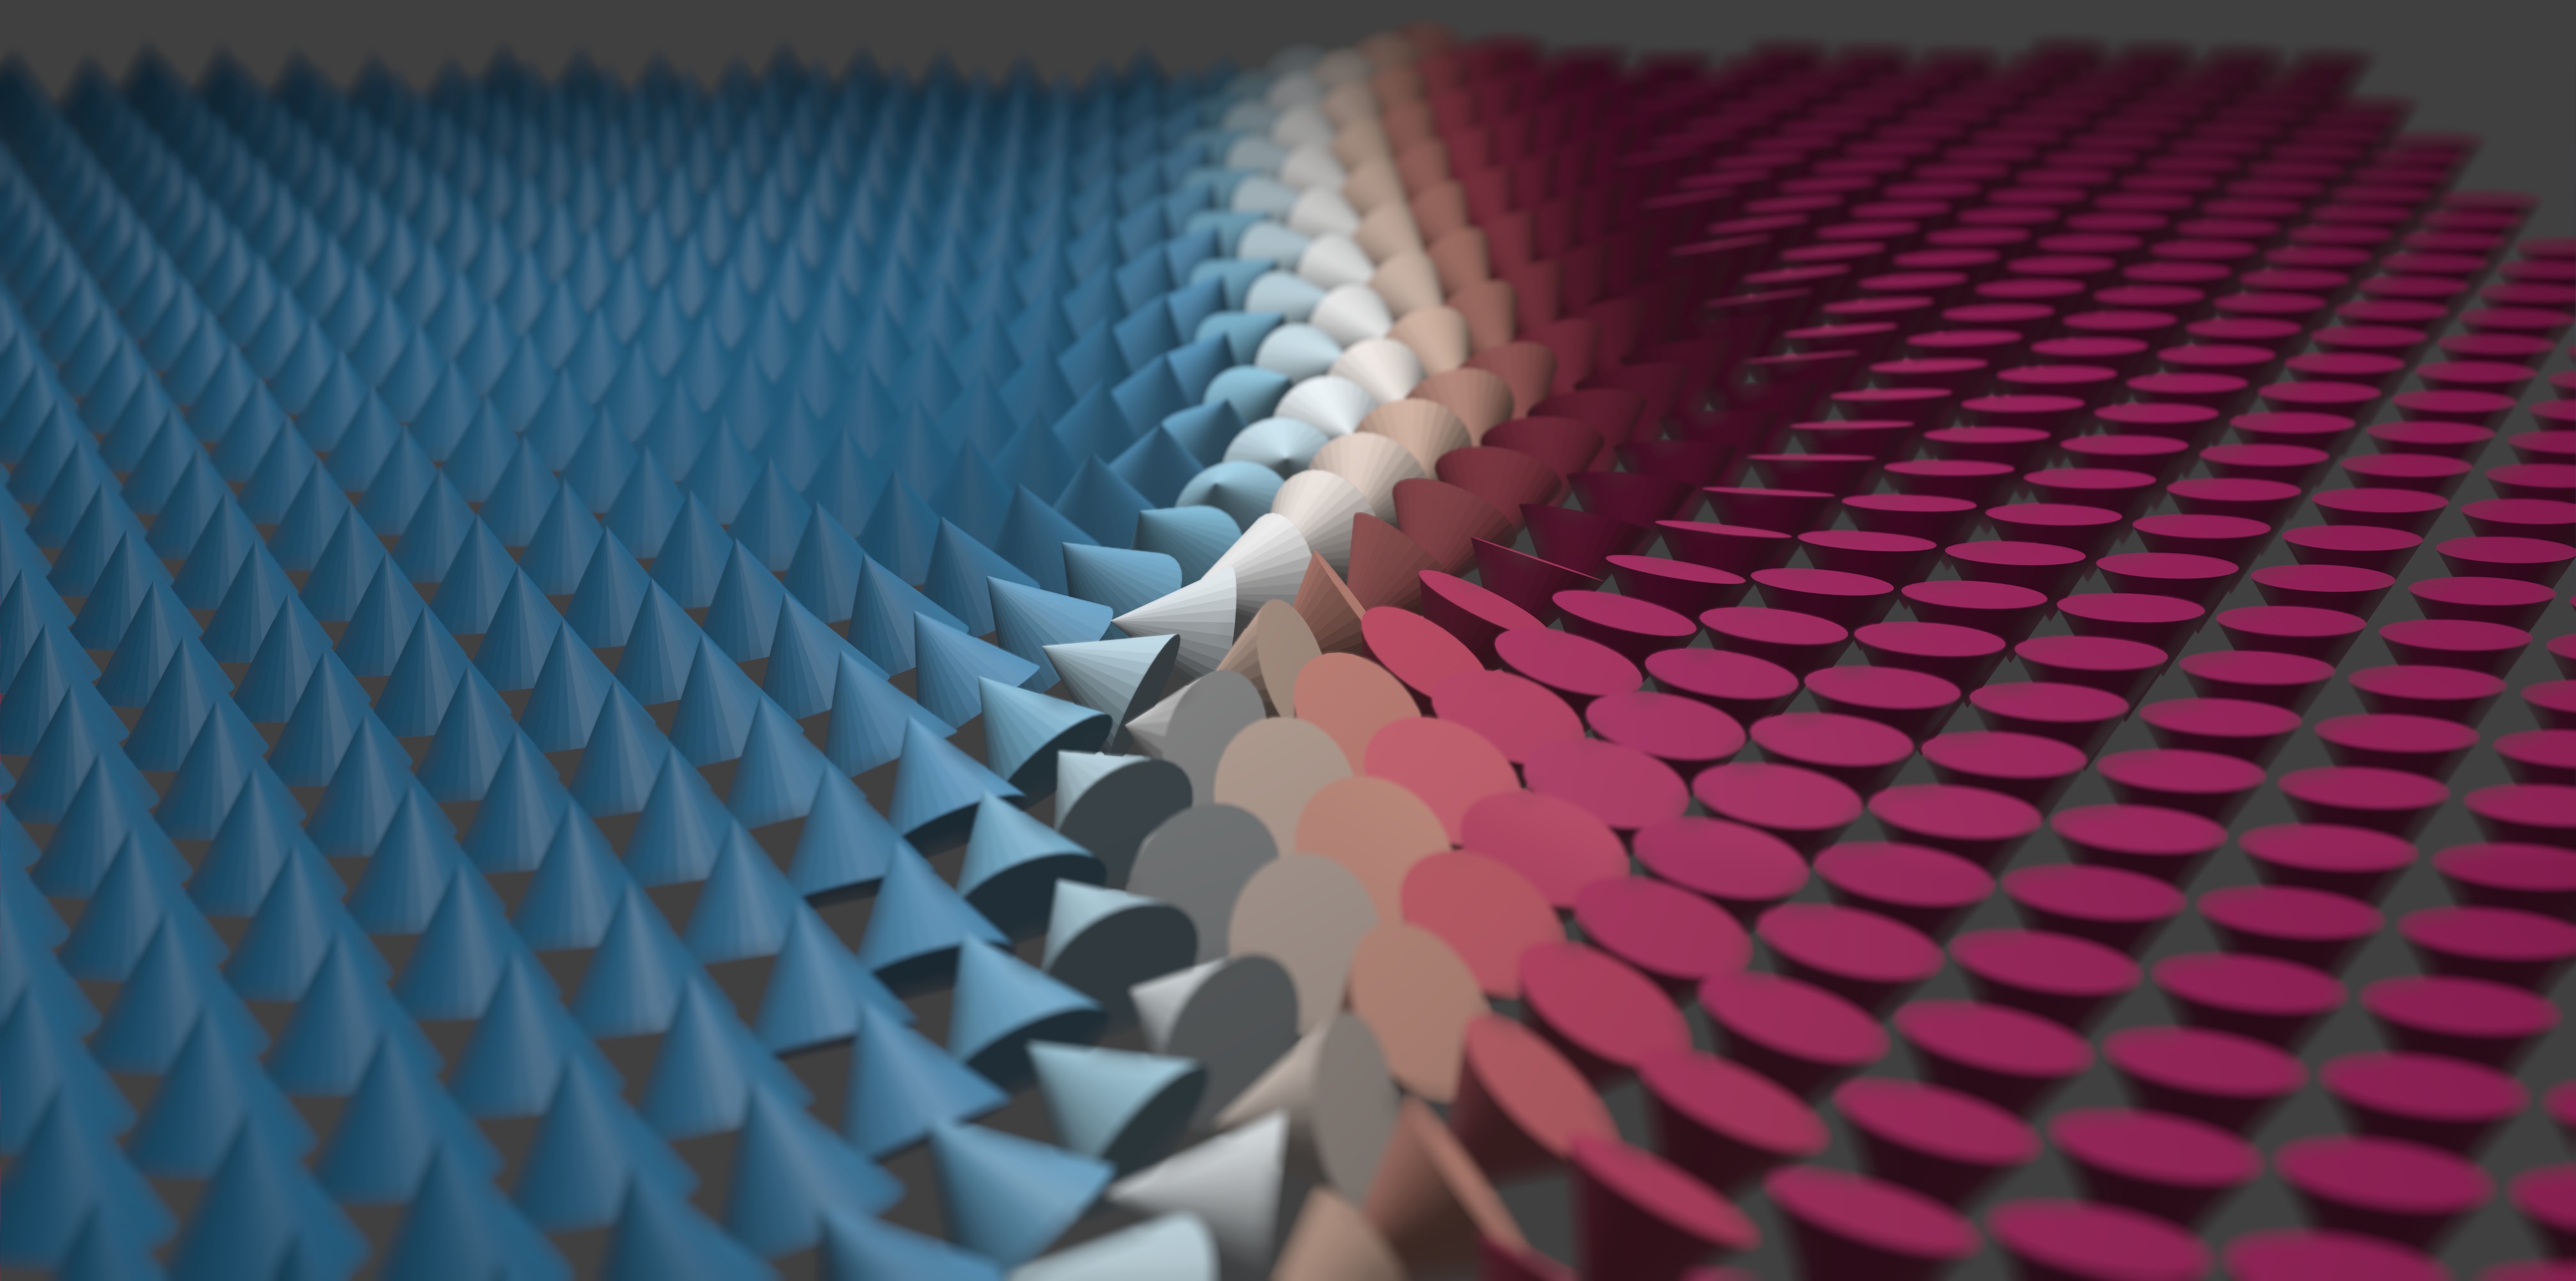
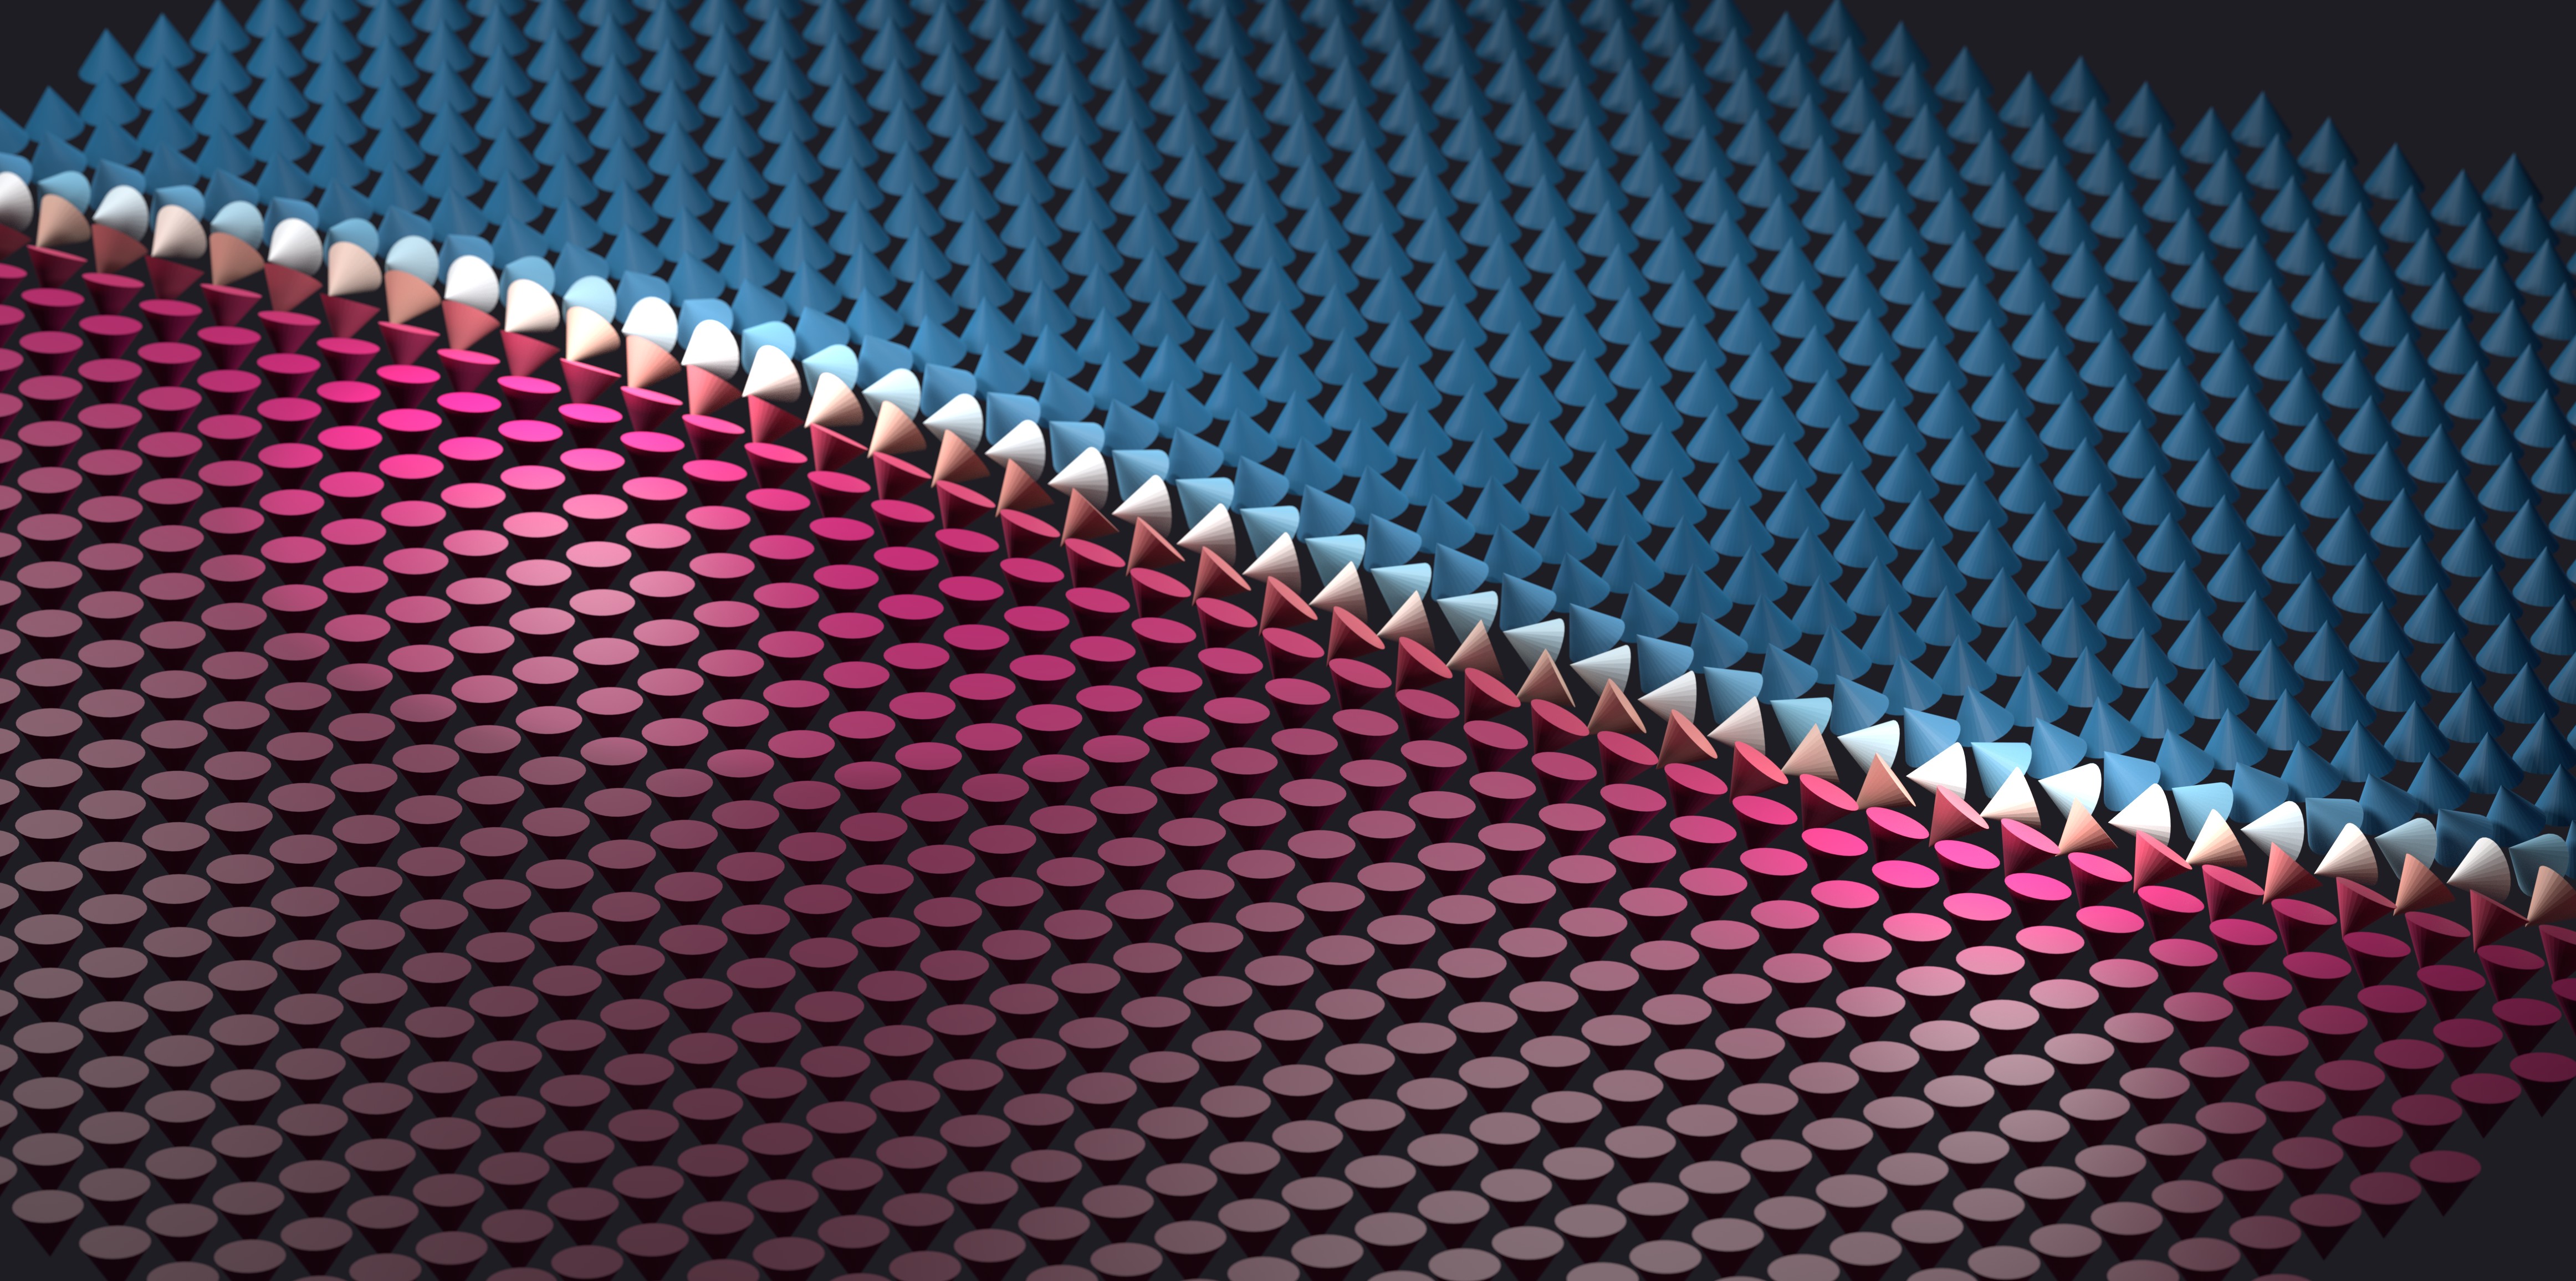
Although the images above were rendered using Blender 2.8, the same method works for Blender 2.79b. Happy rendering!
I am aware that ray tracing is possible in Paraview with OSPRay, but I haven’t been able to figure out how to use it to any real effect. It doesn’t look really much better than rasterization anyway, to say nothing of the customizable lighting, camera, texturing, and post-processing available in blender. ↩︎
It seems like saving only color data (and not alpha values) makes it impossible to display the data into blender. I’m not sure if this is intended behavior or not, or whether it is an issue with Paraview or with blender, but when you import your file in blender the glyphs are just missing. ↩︎